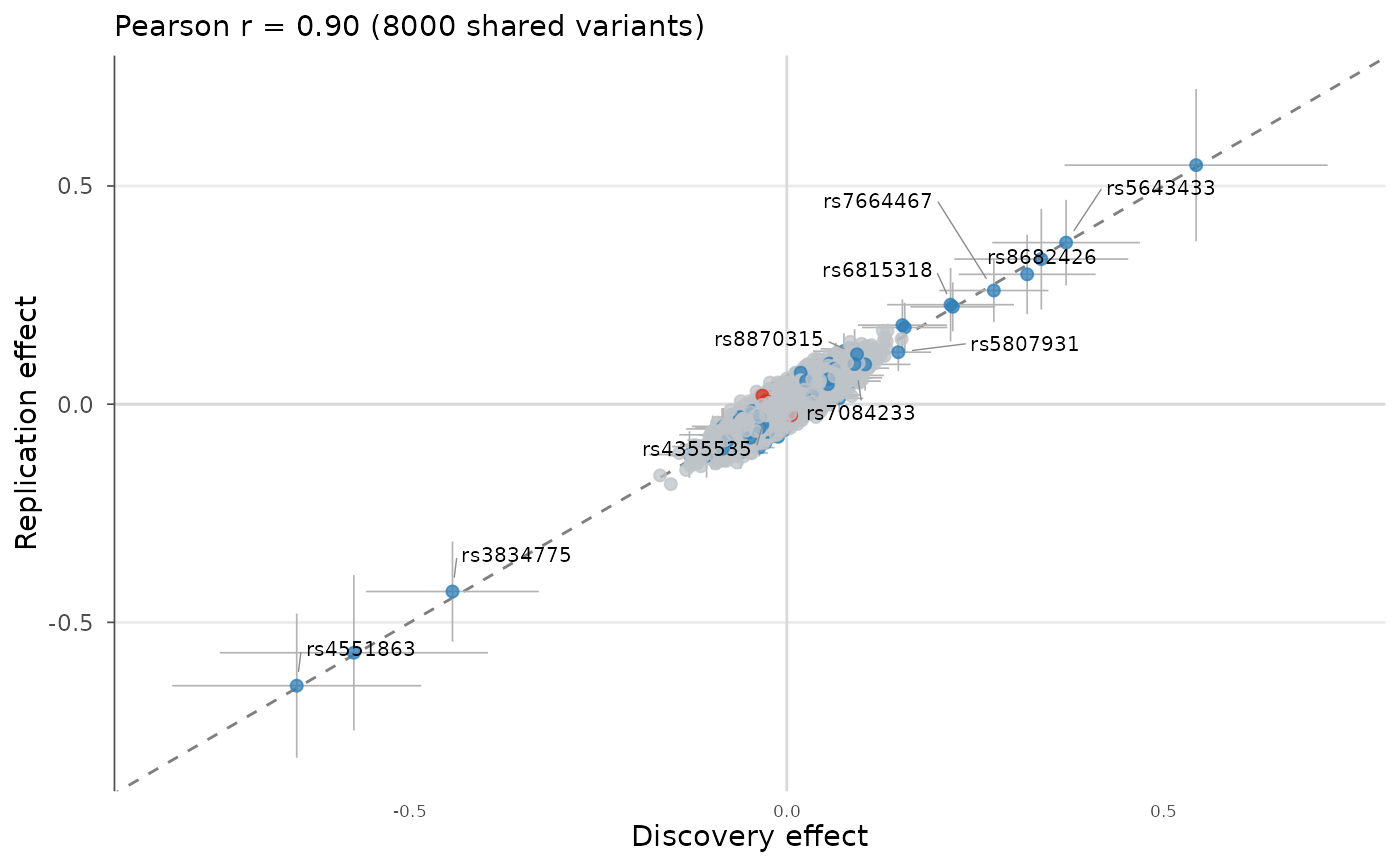
Scatter the per-variant effect sizes of two studies against each other for
the variants they share, to assess replication and effect concordance
(for example discovery versus replication, or two ancestries). A y = x
reference line is drawn; points are colored by whether the two effects
agree in sign among variants significant in either study.
Arguments
- gwas1, gwas2
gwas_dataobjects or data.frames. Variants are matched on the SNP column.- snp, beta, se, p
Column name overrides applied to both inputs when they are plain data.frames.
- labels
Length-2 character vector of axis labels.
- p_threshold
Significance threshold used to classify variants.
- show_ci
If TRUE, draw confidence-interval crosses for the significant variants (requires SE columns).
- ci
Confidence level for the crosses.
- label_top_n
Label the N most significant shared variants.
- colors
Named colors for "concordant", "discordant" and "ns".
- point_size
Point size.
- title
Plot title.