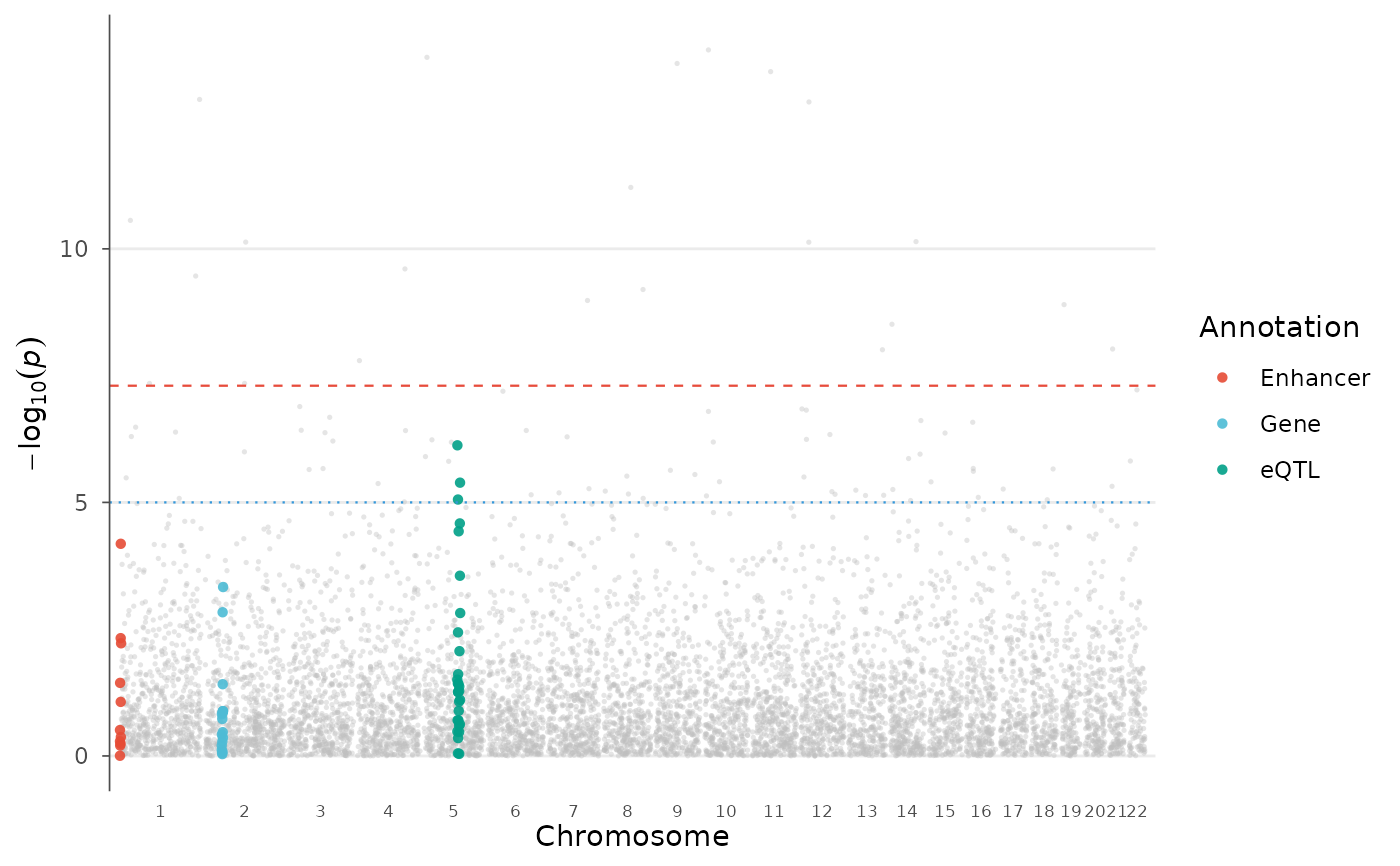
A Manhattan plot with colored overlays for functional genomic annotations. SNPs falling within annotated regions (genes, enhancers, eQTLs, custom categories) are highlighted with distinct colors, connecting GWAS results with functional genomics.
Usage
enrichment_manhattan(
  data,
  annotations,
  chr = NULL,
  bp = NULL,
  p = NULL,
  snp = NULL,
  background_color = "grey75",
  background_alpha = 0.4,
  annotation_colors = NULL,
  annotation_size = 1.5,
  annotation_alpha = 0.9,
  annotation_shape = 16,
  show_legend = TRUE,
  legend_position = "right",
  genome_wide = 5e-08,
  suggestive = 1e-05,
  label_top_n = NULL,
  label_column = "SNP",
  downsample = TRUE,
  downsample_n = 2e+05,
  title = NULL,
  palette = "nature"
)
Arguments
- data
A
gwas_dataobject or data.frame.- annotations
A data.frame or list of data.frames with annotation regions. Each must have columns:
chr(integer),start,end. Optionally:category(annotation type),name(region label). If a named list, names are used as category labels.- chr, bp, p, snp
Column name overrides.
- background_color
Color for non-annotated SNPs.
- background_alpha
Transparency of background points.
- annotation_colors
Named vector of colors for each annotation category. If NULL, uses a colorblind-friendly palette.
- annotation_size
Point size for annotated SNPs.
- annotation_alpha
Transparency of annotated SNPs.
- annotation_shape
Point shape for annotated SNPs (default 16, circle).
- show_legend
Show legend for annotation categories.
- legend_position
Legend position.
- genome_wide
Genome-wide significance threshold.
- suggestive
Suggestive significance threshold.
- label_top_n
Label top N annotated significant SNPs.
- label_column
Column to use for labels.
- downsample
Enable smart downsampling.
- downsample_n
Target number of background points.
- title
Plot title.
- palette
Color palette for annotations (from
gwas_palette()).