Create a regional association plot centered on a genomic region or lead SNP, with optional LD coloring and gene annotation track.
Usage
locus_plot(
  data,
  chr = NULL,
  bp = NULL,
  p = NULL,
  snp = NULL,
  region_chr = NULL,
  region_start = NULL,
  region_end = NULL,
  lead_snp = NULL,
  flank = 5e+05,
  ld = NULL,
  ld_colors = c("#2166AC", "#67A9CF", "#78C679", "#F4A582", "#D73027"),
  ld_breaks = c(0, 0.2, 0.4, 0.6, 0.8, 1),
  gene_data = NULL,
  gene_height = 0.25,
  point_size = 2,
  lead_snp_shape = 23,
  lead_snp_size = 4,
  title = NULL
)
Arguments
- data
A
gwas_dataobject or data.frame.- chr, bp, p, snp
Column name overrides.
- region_chr
Chromosome of the region to plot.
- region_start, region_end
Start and end positions.
- lead_snp
SNP ID to center the region around.
- flank
Flank size in bp around the lead SNP (default 500kb).
- ld
Named numeric vector of LD (r2) values with the lead SNP. Names are SNP IDs, values are r2.
- ld_colors
Colors for LD bins (5 levels).
- ld_breaks
Breaks for LD color bins.
- gene_data
A data.frame with columns: chr, start, end, gene, strand.
- gene_height
Proportion of plot height for the gene track.
- point_size
Point size.
- lead_snp_shape
Shape for the lead SNP marker.
- lead_snp_size
Size for the lead SNP marker.
- title
Plot title.
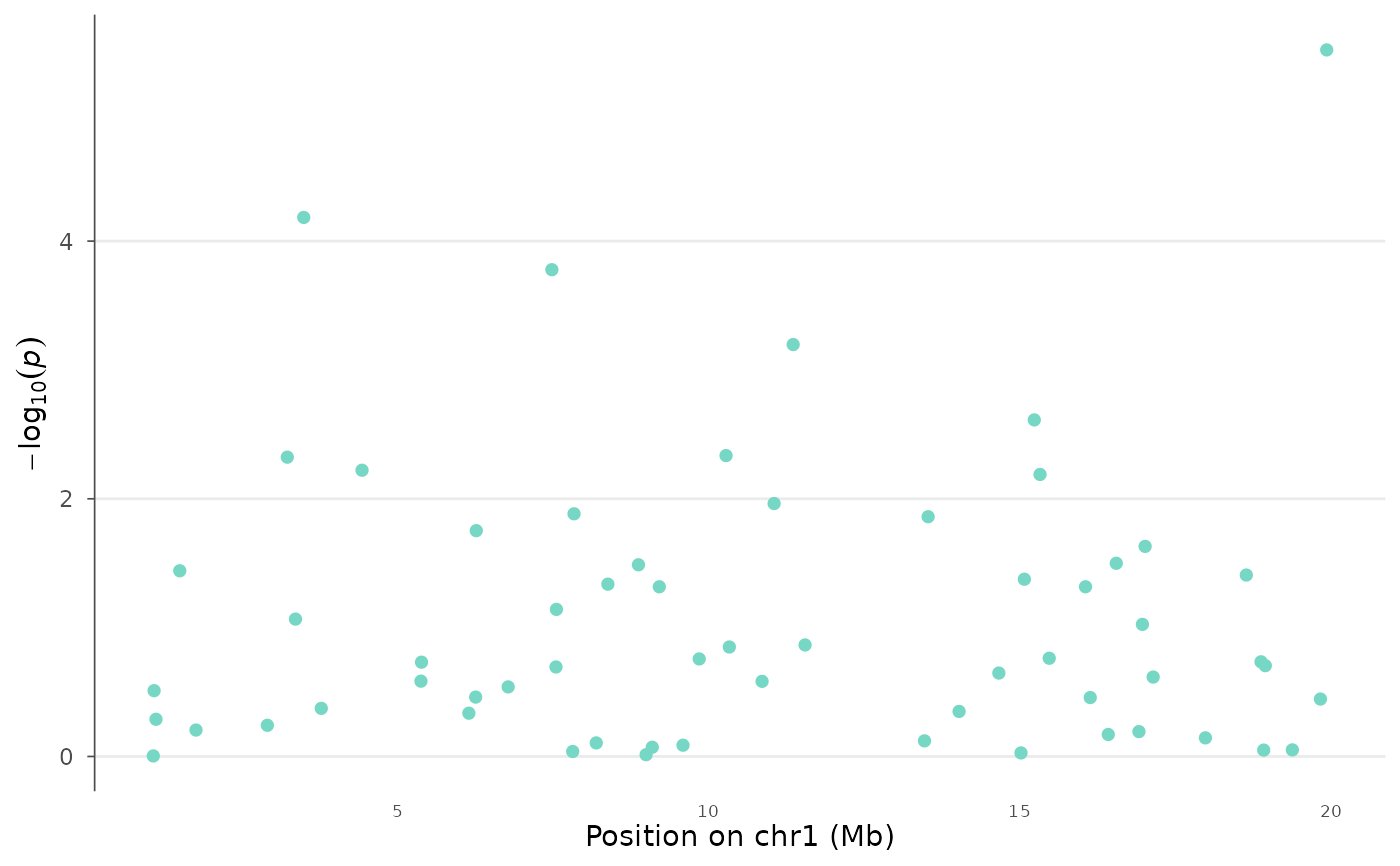
Examples
data(example_gwas, package = "ggwas")
locus_plot(example_gwas, region_chr = 1,
           region_start = 1e6, region_end = 20e6)