Create a genome-wide Manhattan plot from GWAS summary statistics. Returns a ggplot2 object for further customization.
Usage
manhattan_plot(
  data,
  chr = NULL,
  bp = NULL,
  p = NULL,
  snp = NULL,
  colors = c("#1A5276", "#76D7C4"),
  point_size = 0.8,
  alpha = 1,
  genome_wide = 5e-08,
  suggestive = 1e-05,
  threshold_colors = c("#E74C3C", "#3498DB"),
  highlight_snps = NULL,
  highlight_color = "#E74C3C",
  highlight_size = 2,
  label_snps = NULL,
  label_top_n = NULL,
  label_column = "SNP",
  downsample = TRUE,
  downsample_n = 2e+05,
  chromosomes = NULL,
  chr_labels = NULL,
  y_limit = NULL,
  y_truncate = NULL,
  title = NULL
)
Arguments
- data
A
gwas_dataobject or data.frame with GWAS results.- chr, bp, p, snp
Column name overrides (auto-detected if NULL).
- colors
Two-color vector for alternating chromosomes.
- point_size
Point size.
- alpha
Point transparency.
- genome_wide
Genome-wide significance threshold (p-value).
- suggestive
Suggestive significance threshold.
- threshold_colors
Colors for significance lines.
- highlight_snps
Character vector of SNP IDs to highlight.
- highlight_color
Color for highlighted SNPs.
- highlight_size
Size for highlighted points.
- label_snps
Character vector of SNP IDs to label.
- label_top_n
Label the top N most significant SNPs.
- label_column
Column to use for label text.
- downsample
Enable smart downsampling for large datasets.
- downsample_n
Target number of points after downsampling.
- chromosomes
Subset of chromosomes to plot (integer vector).
- chr_labels
Custom chromosome labels (character vector, same length as displayed chromosomes). If NULL, auto-generated from chromosome numbers.
- y_limit
Upper y-axis limit for -log10(p).
- y_truncate
Break the y-axis to cut out a middle region. Either a single value (break point, resumes at max value) or a vector of two values
c(break_from, resume_at)defining the cut range in -log10(p) units. For example,y_truncate = c(15, 50)shows 0-15 at full scale, cuts 15-50, then shows 50+ above the break.- title
Plot title.
Examples
data(example_gwas, package = "ggwas")
# Basic Manhattan plot
manhattan_plot(example_gwas)
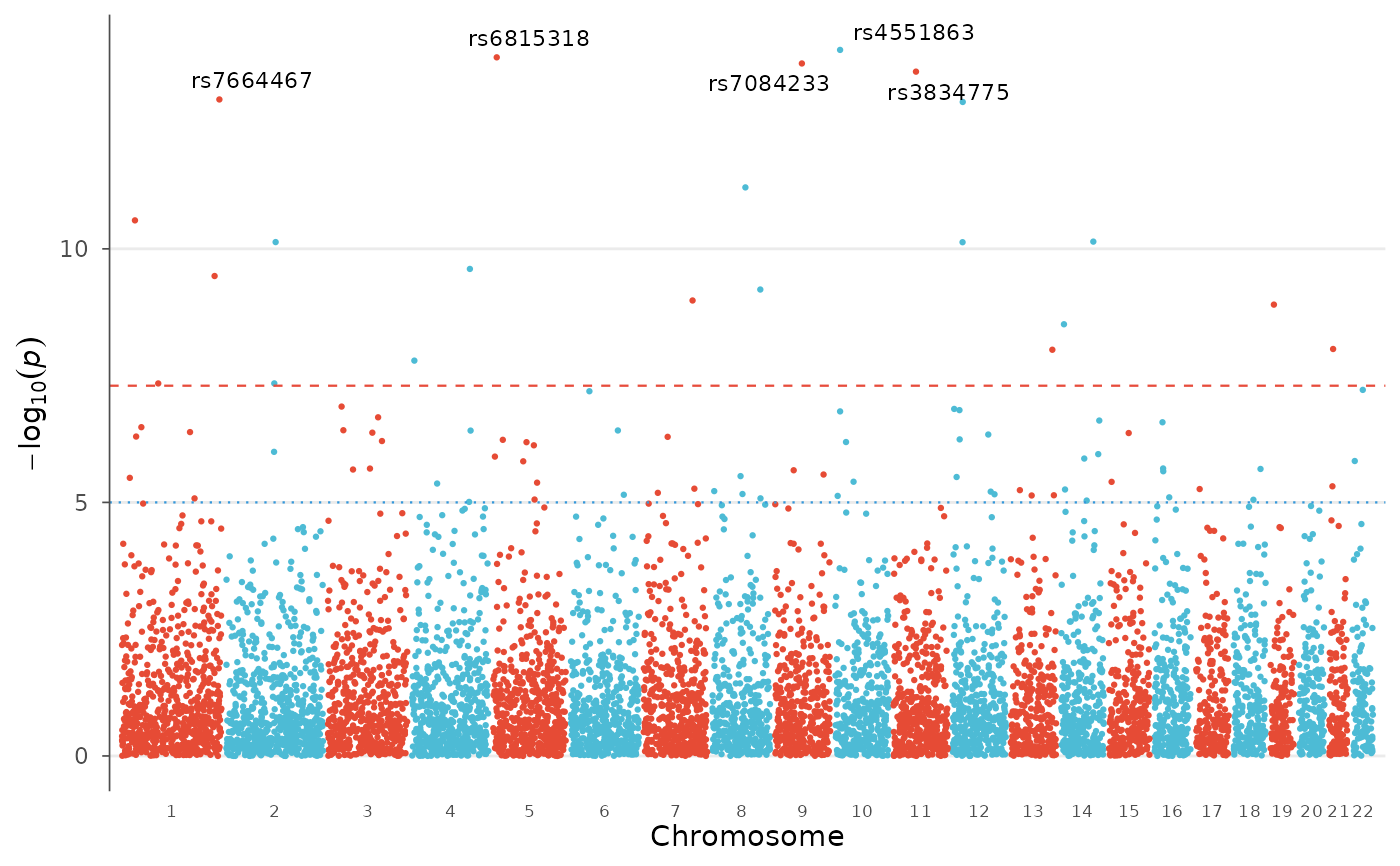
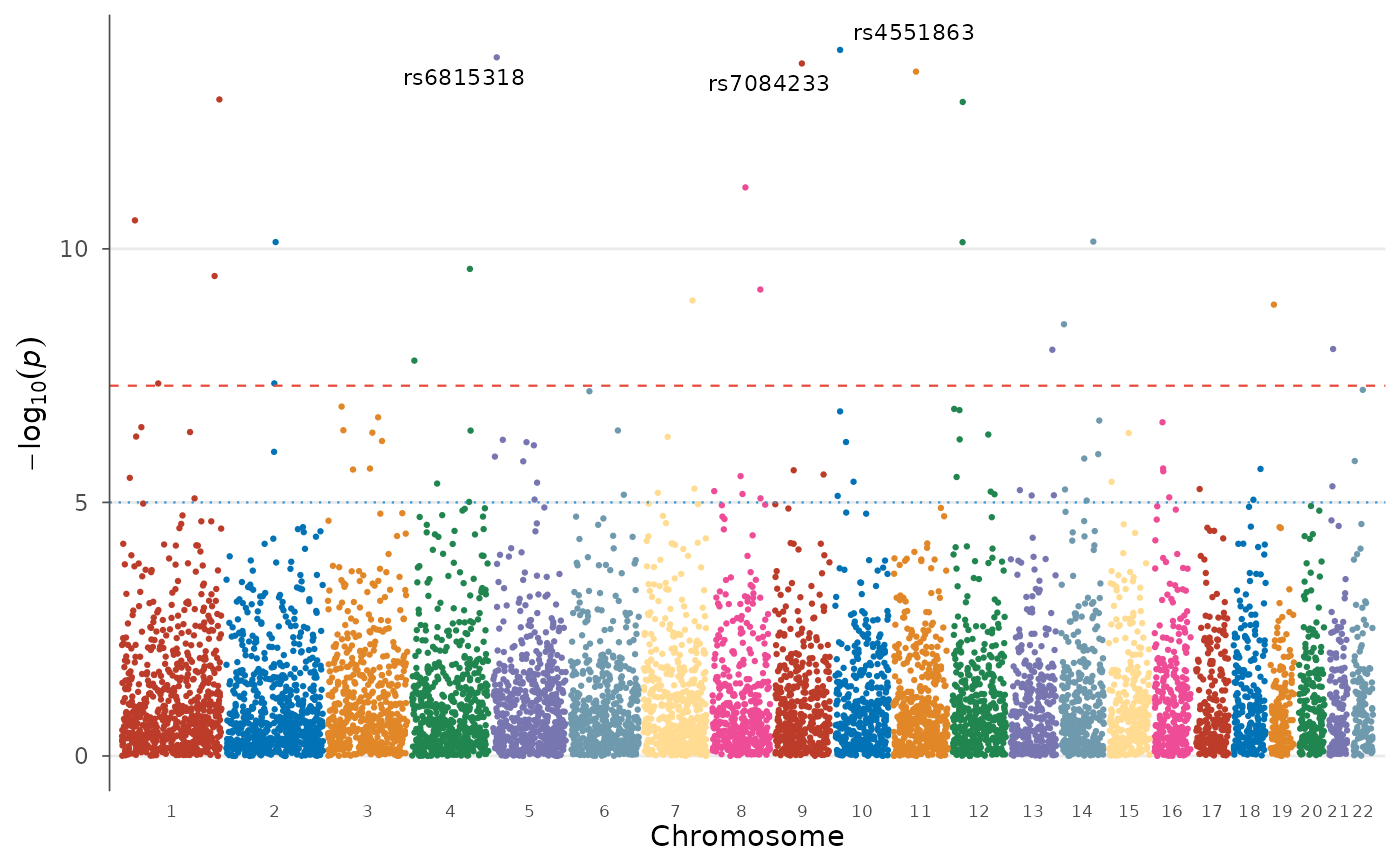
 # Label top hits with a different palette
manhattan_plot(example_gwas, label_top_n = 5, colors = gwas_palette("vibrant"))
# Label top hits with a different palette
manhattan_plot(example_gwas, label_top_n = 5, colors = gwas_palette("vibrant"))
 # Nature journal style
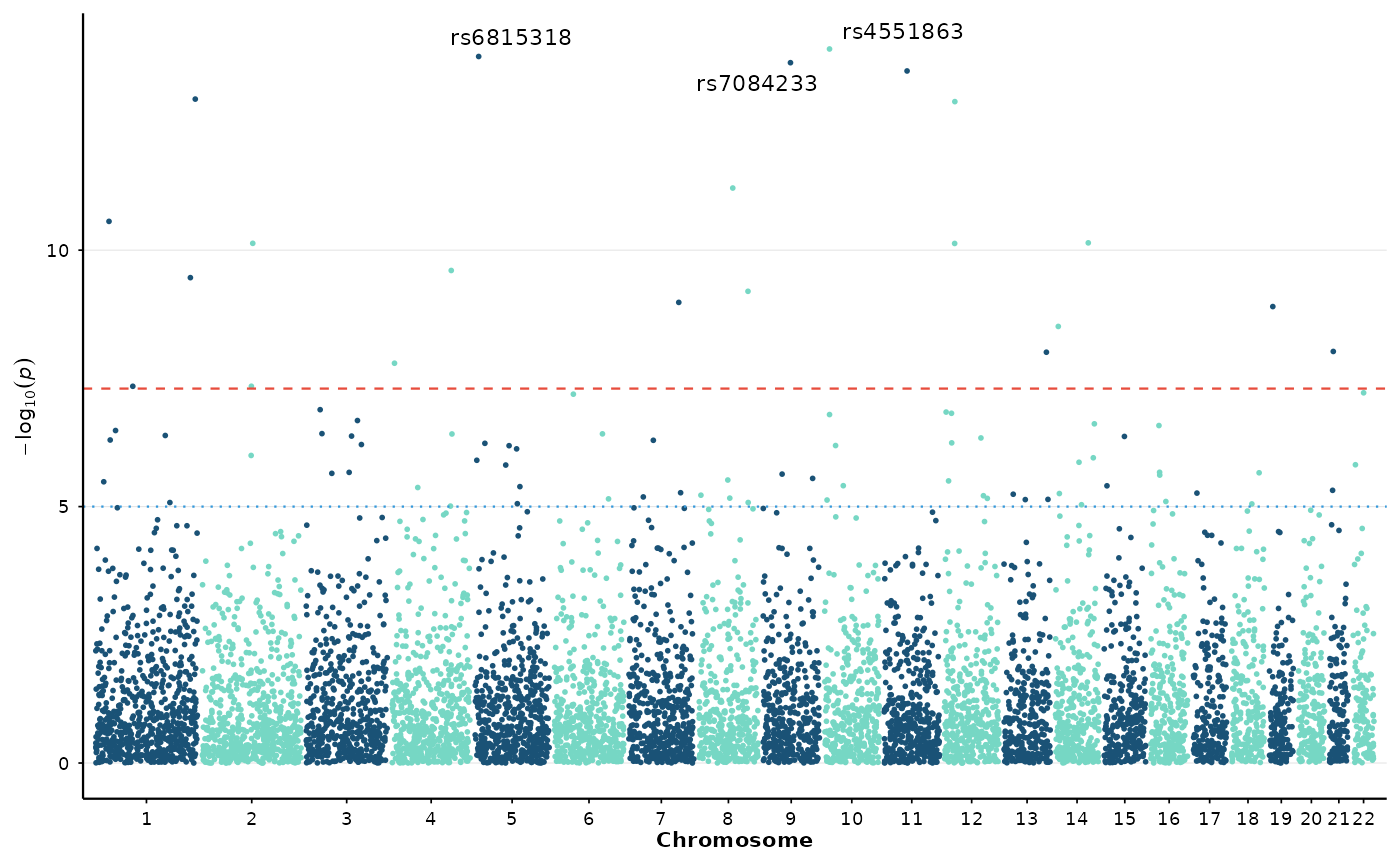
manhattan_plot(example_gwas, label_top_n = 3) + theme_nature()
# Nature journal style
manhattan_plot(example_gwas, label_top_n = 3) + theme_nature()
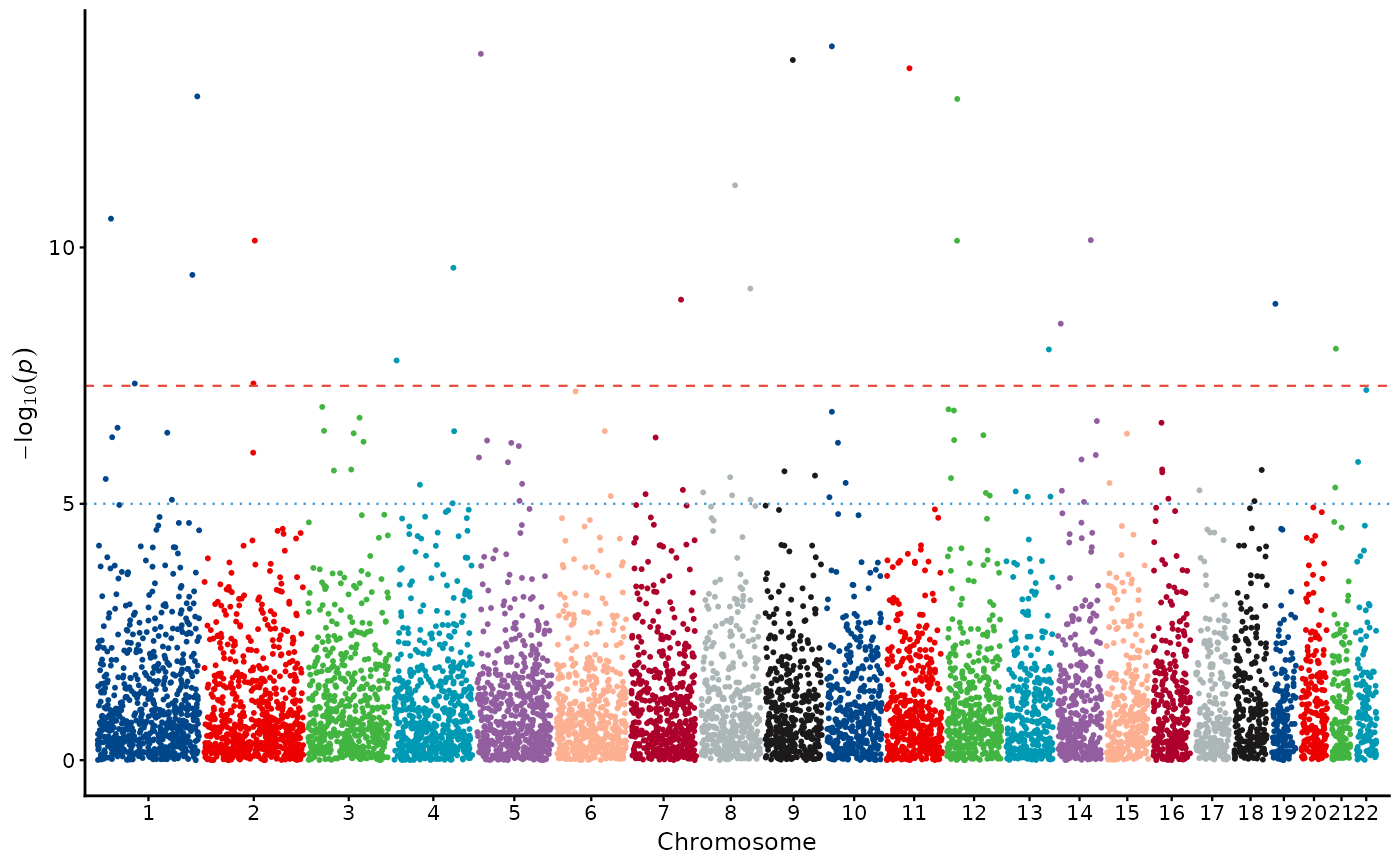
 # Lancet palette with Science theme
manhattan_plot(example_gwas, colors = gwas_palette("lancet")) + theme_science()
# Lancet palette with Science theme
manhattan_plot(example_gwas, colors = gwas_palette("lancet")) + theme_science()
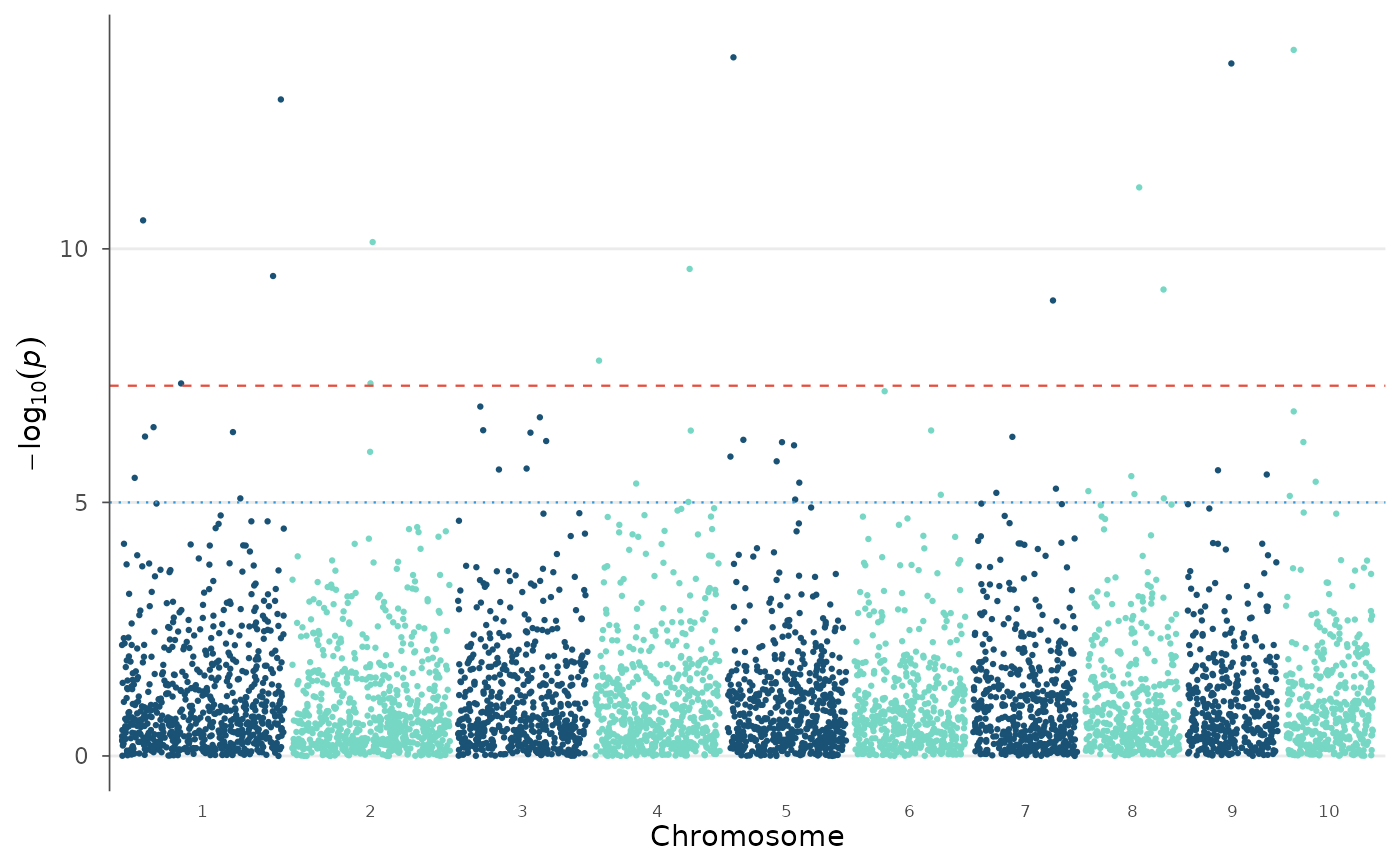
 # Subset chromosomes
manhattan_plot(example_gwas, chromosomes = 1:10)
# Subset chromosomes
manhattan_plot(example_gwas, chromosomes = 1:10)
 # NEJM palette
manhattan_plot(example_gwas, colors = gwas_palette("nejm"), label_top_n = 3)
# NEJM palette
manhattan_plot(example_gwas, colors = gwas_palette("nejm"), label_top_n = 3)
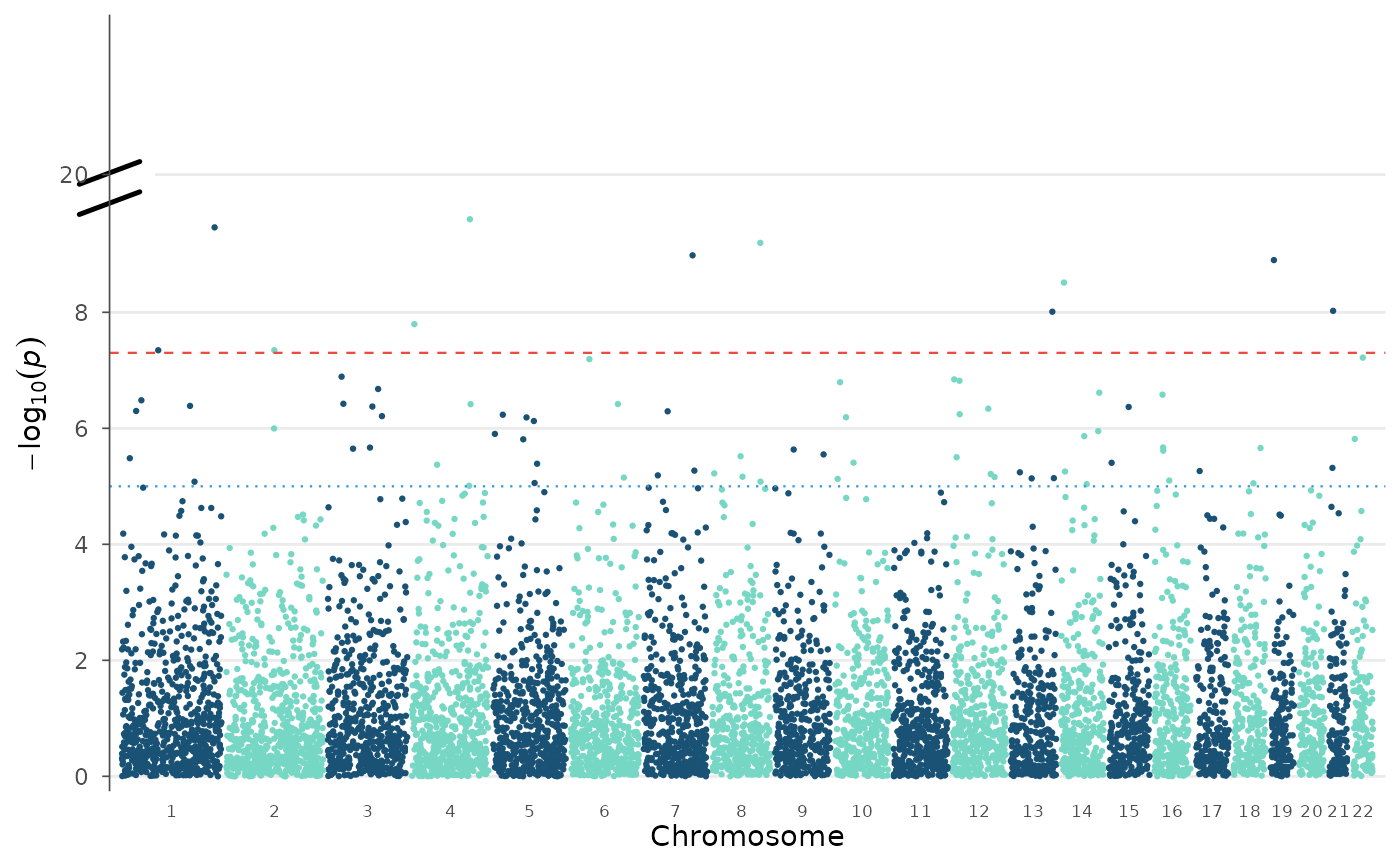
 # Broken y-axis: cut 10-50, show 0-10 and 50+
manhattan_plot(example_gwas, y_truncate = c(10, 50))
# Broken y-axis: cut 10-50, show 0-10 and 50+
manhattan_plot(example_gwas, y_truncate = c(10, 50))
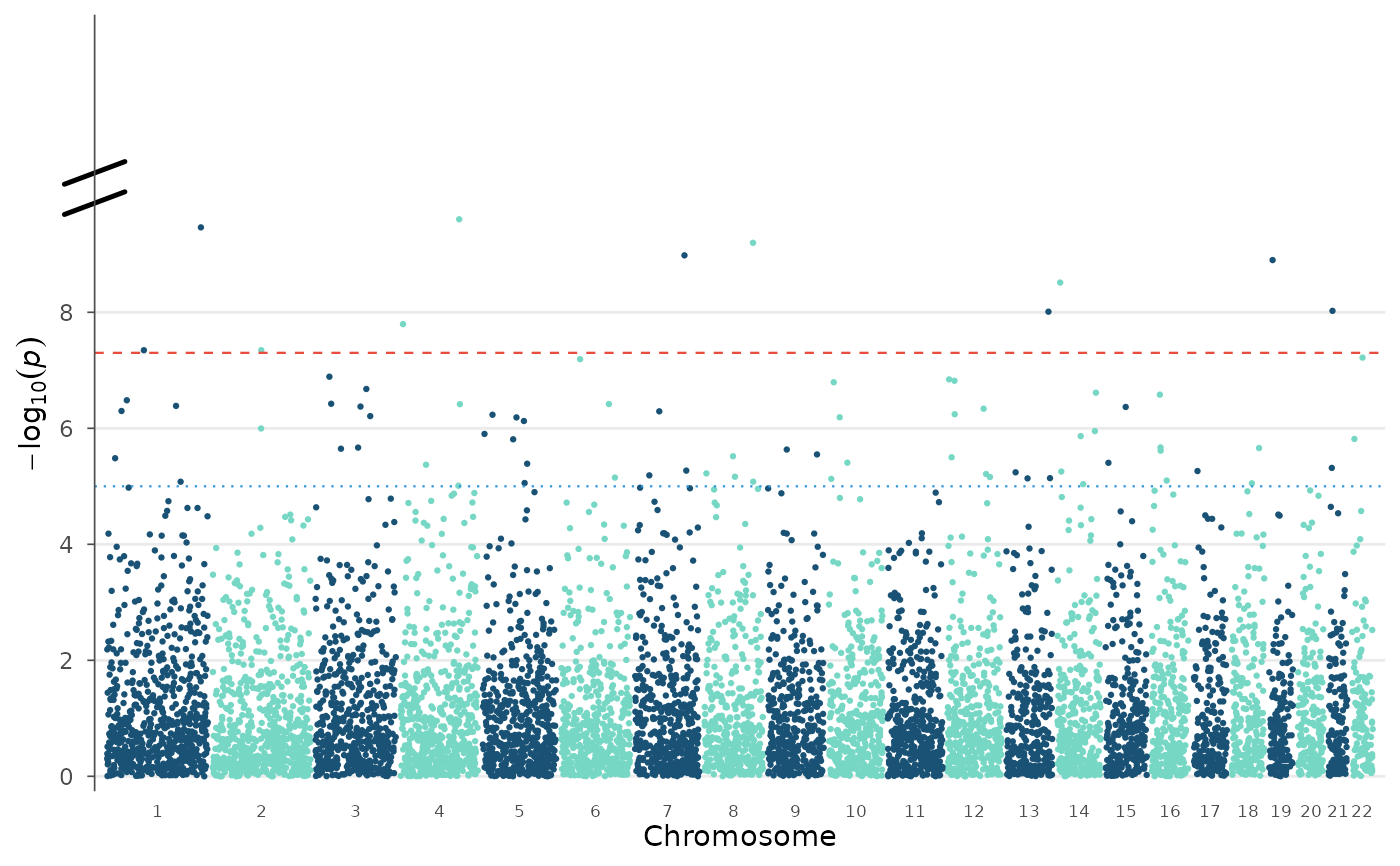 # Single value: auto-detect resume point
manhattan_plot(example_gwas, y_truncate = 10)
# Single value: auto-detect resume point
manhattan_plot(example_gwas, y_truncate = 10)
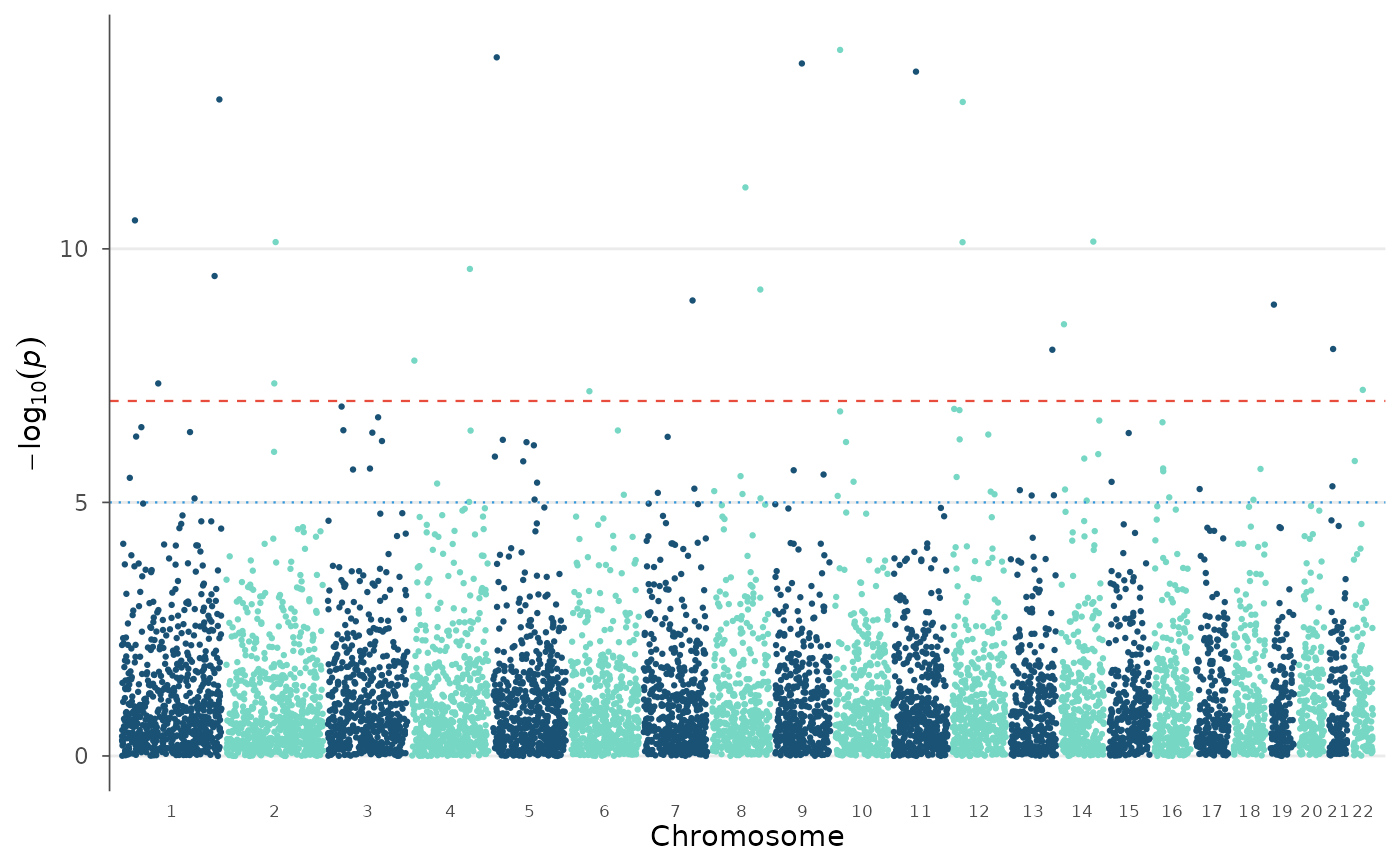
 # Custom significance threshold (Bonferroni for 500k SNPs)
manhattan_plot(example_gwas, genome_wide = 0.05 / 500000)
# Custom significance threshold (Bonferroni for 500k SNPs)
manhattan_plot(example_gwas, genome_wide = 0.05 / 500000)
 # No threshold lines
manhattan_plot(example_gwas, genome_wide = NULL, suggestive = NULL)
# No threshold lines
manhattan_plot(example_gwas, genome_wide = NULL, suggestive = NULL)
