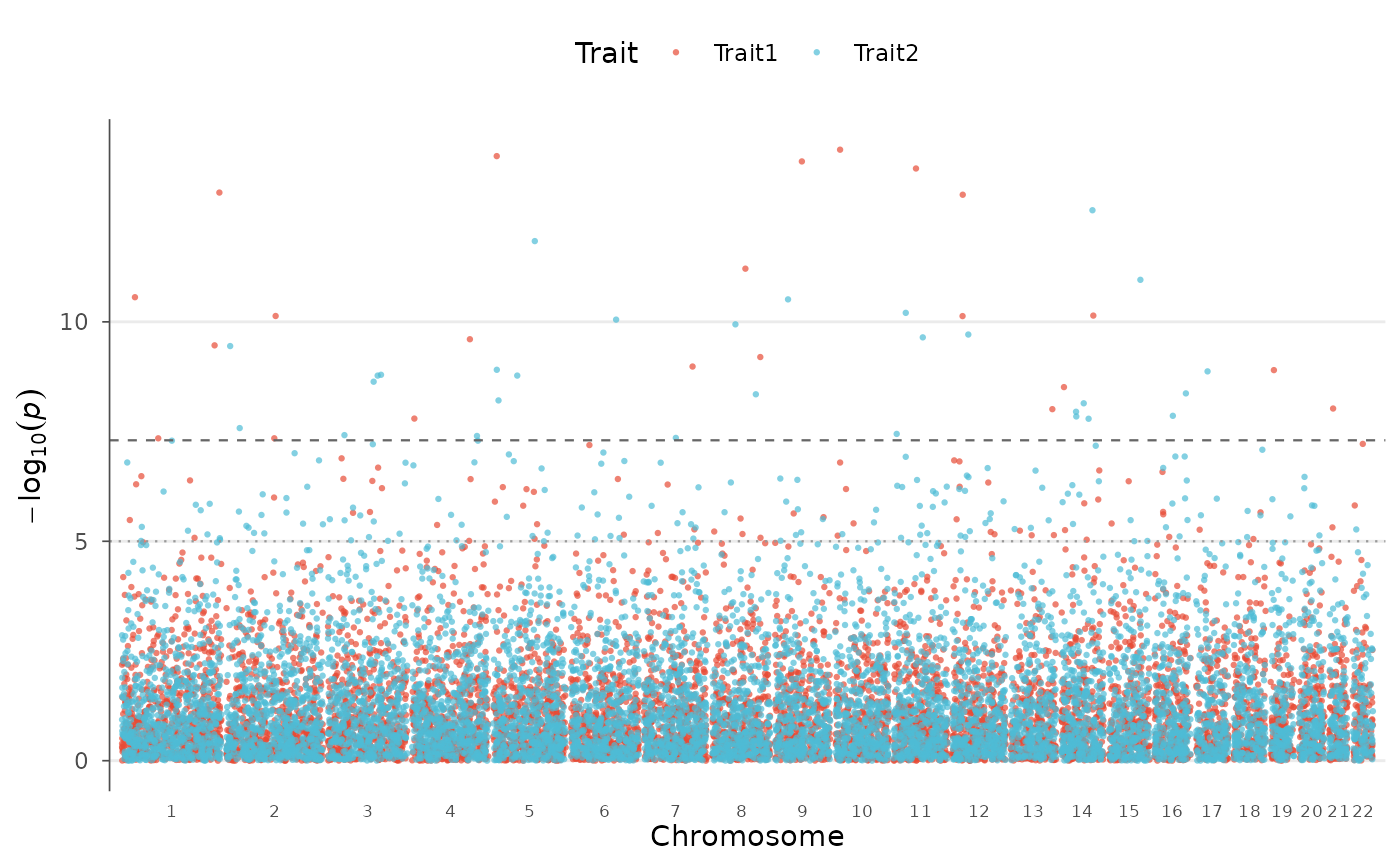
Overlay results from multiple GWAS traits or studies on a single Manhattan plot. Each trait is shown in a different color and optionally a different shape, enabling visual identification of shared and trait-specific loci (pleiotropy).
Usage
multitrait_manhattan(
  ...,
  chr = NULL,
  bp = NULL,
  p = NULL,
  snp = NULL,
  colors = "nature",
  shapes = NULL,
  point_size = 0.8,
  alpha = 0.7,
  genome_wide = 5e-08,
  suggestive = 1e-05,
  show_legend = TRUE,
  legend_position = "top",
  highlight_shared = TRUE,
  shared_color = "#9B59B6",
  shared_size = 2.5,
  label_shared_n = NULL,
  downsample = TRUE,
  downsample_n = 150000,
  title = NULL
)
Arguments
- ...
Named
gwas_dataobjects or data.frames. Names are used as trait labels. Alternatively, pass a single named list.- chr, bp, p, snp
Column name overrides applied to all datasets.
- colors
Named vector of colors per trait, or a palette name from
gwas_palette().- shapes
Named vector of point shapes per trait (integers). If NULL, all use shape 16 (circle).
- point_size
Point size (can be a named vector per trait).
- alpha
Point transparency.
- genome_wide
Genome-wide significance threshold.
- suggestive
Suggestive significance threshold.
- show_legend
Show trait legend.
- legend_position
Legend position.
Highlight SNPs significant in multiple traits.
Color for shared significant SNPs.
Size for shared significant SNPs.
Label top N shared significant SNPs.
- downsample
Enable smart downsampling per trait.
- downsample_n
Target points per trait.
- title
Plot title.