A compact, binned heatmap of association signals across the genome. Each cell represents a genomic bin colored by the summary statistic (minimum p-value, median, or count of significant variants). Handles 10M+ SNPs efficiently through pre-aggregation.
Usage
pvalue_heatmap(
  data,
  chr = NULL,
  bp = NULL,
  p = NULL,
  bin_size = 1e+06,
  summary_fun = "min",
  palette = "viridis",
  na_color = "grey95",
  threshold = 5e-08,
  chromosomes = NULL,
  title = NULL
)
Arguments
- data
A
gwas_dataobject or data.frame.- chr, bp, p
Column name overrides.
- bin_size
Bin size in base pairs (default 1 Mb).
- summary_fun
How to summarize p-values per bin: "min" (default), "median", or "count_sig" (count of variants below
threshold).- palette
Color palette: "viridis", "magma", "inferno", or "plasma".
- na_color
Color for empty bins.
- threshold
Significance threshold for count_sig mode and for marking significant bins.
- chromosomes
Subset of chromosomes to show.
- title
Plot title.
Examples
data(example_gwas, package = "ggwas")
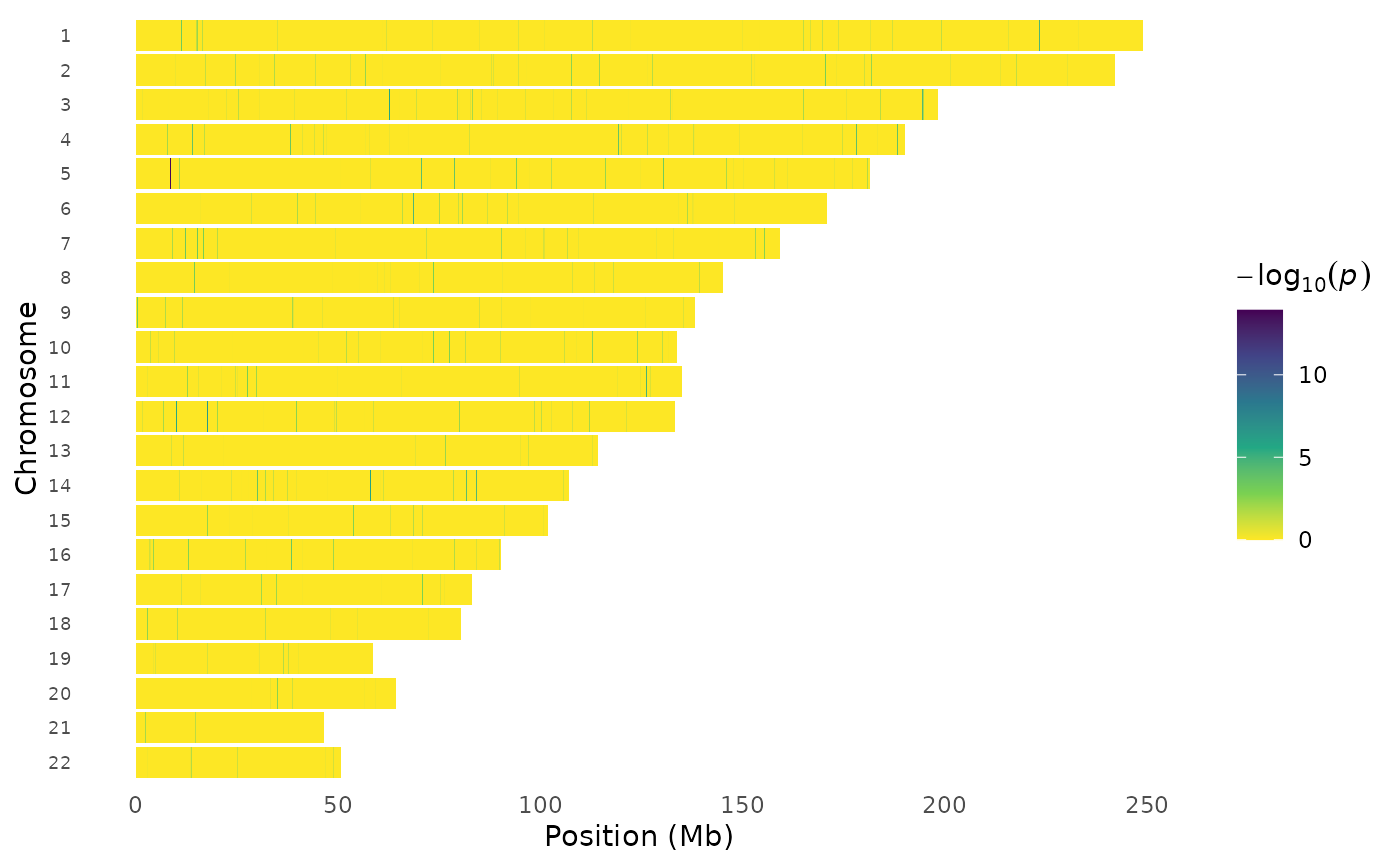
# Default (viridis)
pvalue_heatmap(example_gwas, bin_size = 10000)
 # Magma palette
pvalue_heatmap(example_gwas, bin_size = 10000, palette = "magma")
# Magma palette
pvalue_heatmap(example_gwas, bin_size = 10000, palette = "magma")
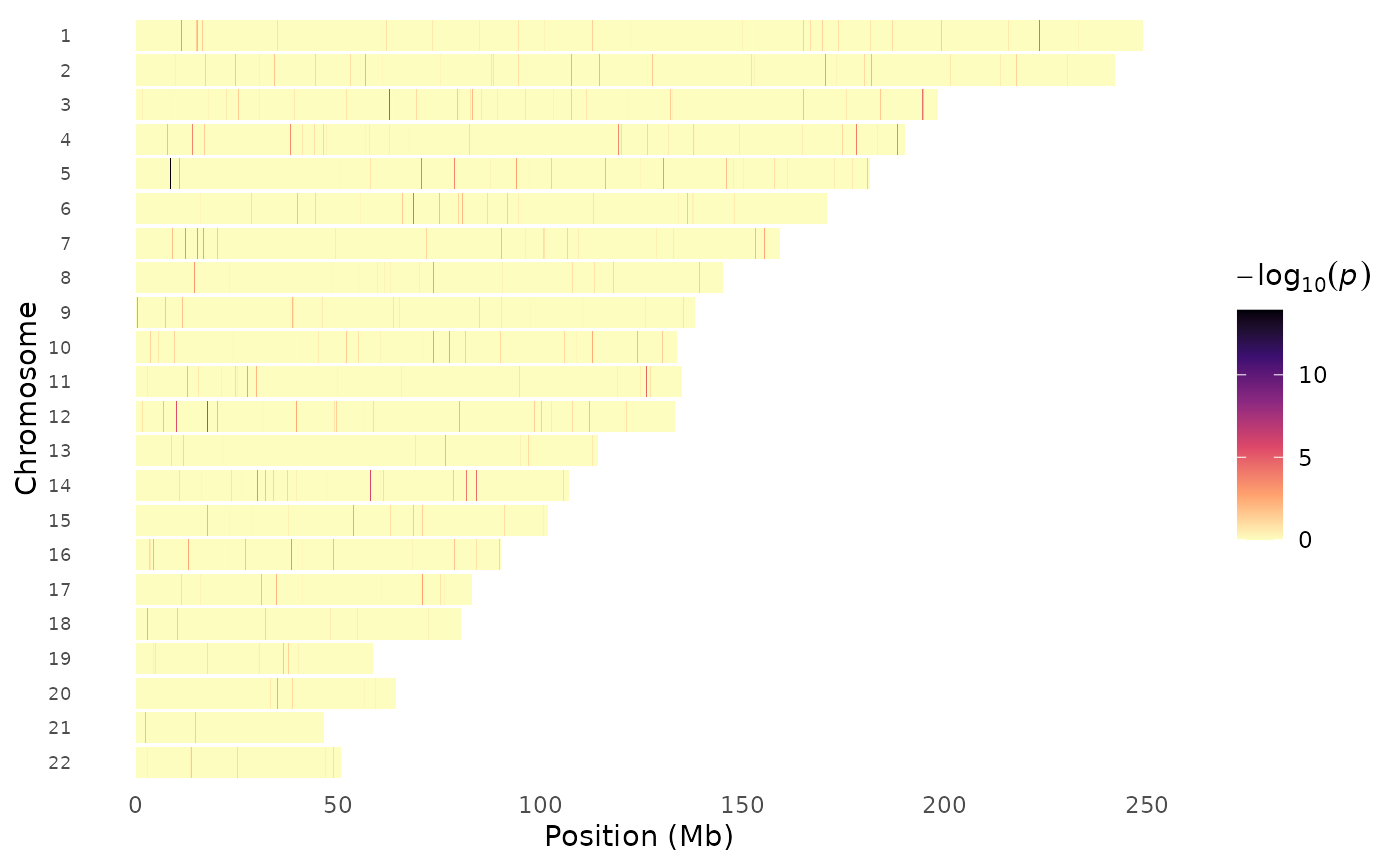 # Inferno palette
pvalue_heatmap(example_gwas, bin_size = 10000, palette = "inferno")
# Inferno palette
pvalue_heatmap(example_gwas, bin_size = 10000, palette = "inferno")
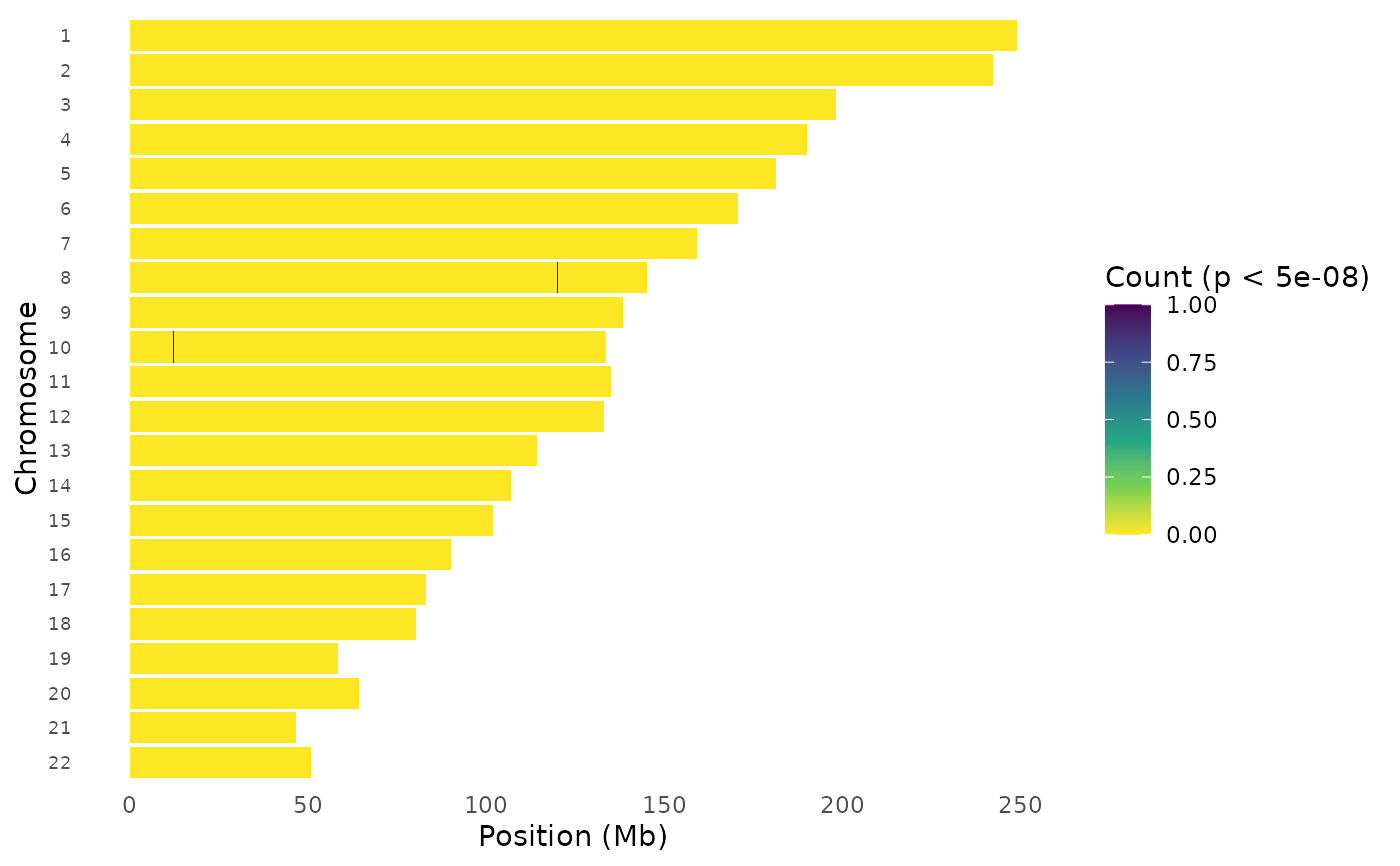
 # Count significant variants per bin
pvalue_heatmap(example_gwas, bin_size = 10000, summary_fun = "count_sig")
# Count significant variants per bin
pvalue_heatmap(example_gwas, bin_size = 10000, summary_fun = "count_sig")