Create a quantile-quantile plot with confidence bands and genomic inflation factor.
Usage
qq_plot(
  data,
  p = NULL,
  ci = 0.95,
  ci_fill = "grey80",
  ci_alpha = 0.3,
  show_lambda = TRUE,
  lambda_position = "topleft",
  group = NULL,
  point_size = 0.8,
  point_color = "#1A5276",
  alpha = 1,
  line_color = "#E74C3C",
  downsample = TRUE,
  downsample_n = 1e+05,
  title = NULL
)
Arguments
- data
A
gwas_dataobject or data.frame, or a numeric vector of p-values.- p
Column name for p-values (auto-detected if NULL).
- ci
Confidence level for bands (NULL to disable).
- ci_fill
Fill color for confidence band.
- ci_alpha
Transparency of confidence band.
- show_lambda
Show genomic inflation factor annotation.
- lambda_position
Position for lambda annotation: "topleft" or "bottomright".
- group
Column name to stratify QQ plot by groups.
- point_size
Point size.
- point_color
Point color (ignored if group is specified).
- alpha
Point transparency.
- line_color
Color of the identity line.
- downsample
Enable downsampling of dense lower-left region.
- downsample_n
Target number of points.
- title
Plot title.
Examples
data(example_gwas, package = "ggwas")
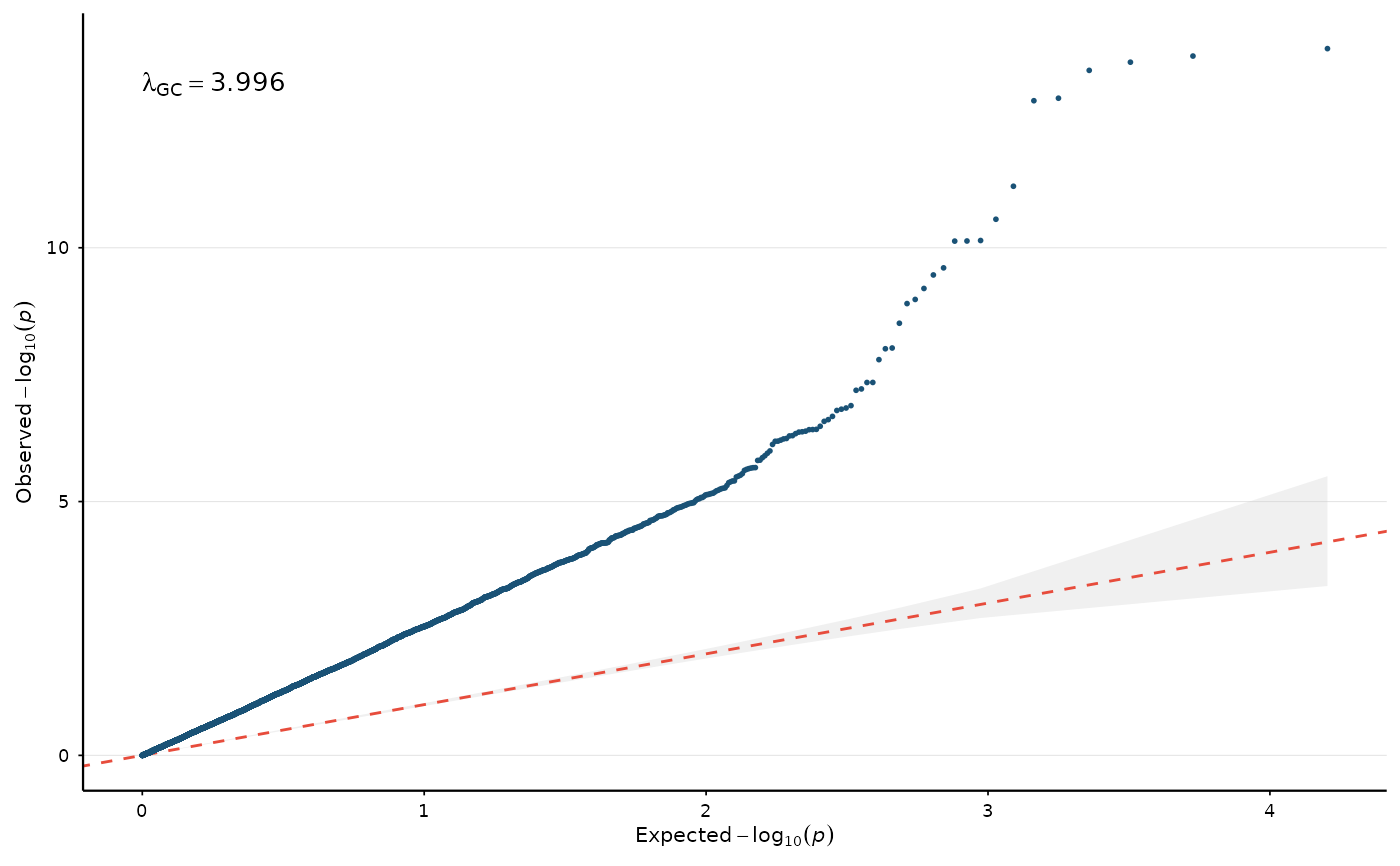
# Basic QQ with lambda and confidence band
qq_plot(example_gwas, show_lambda = TRUE, ci = 0.95)
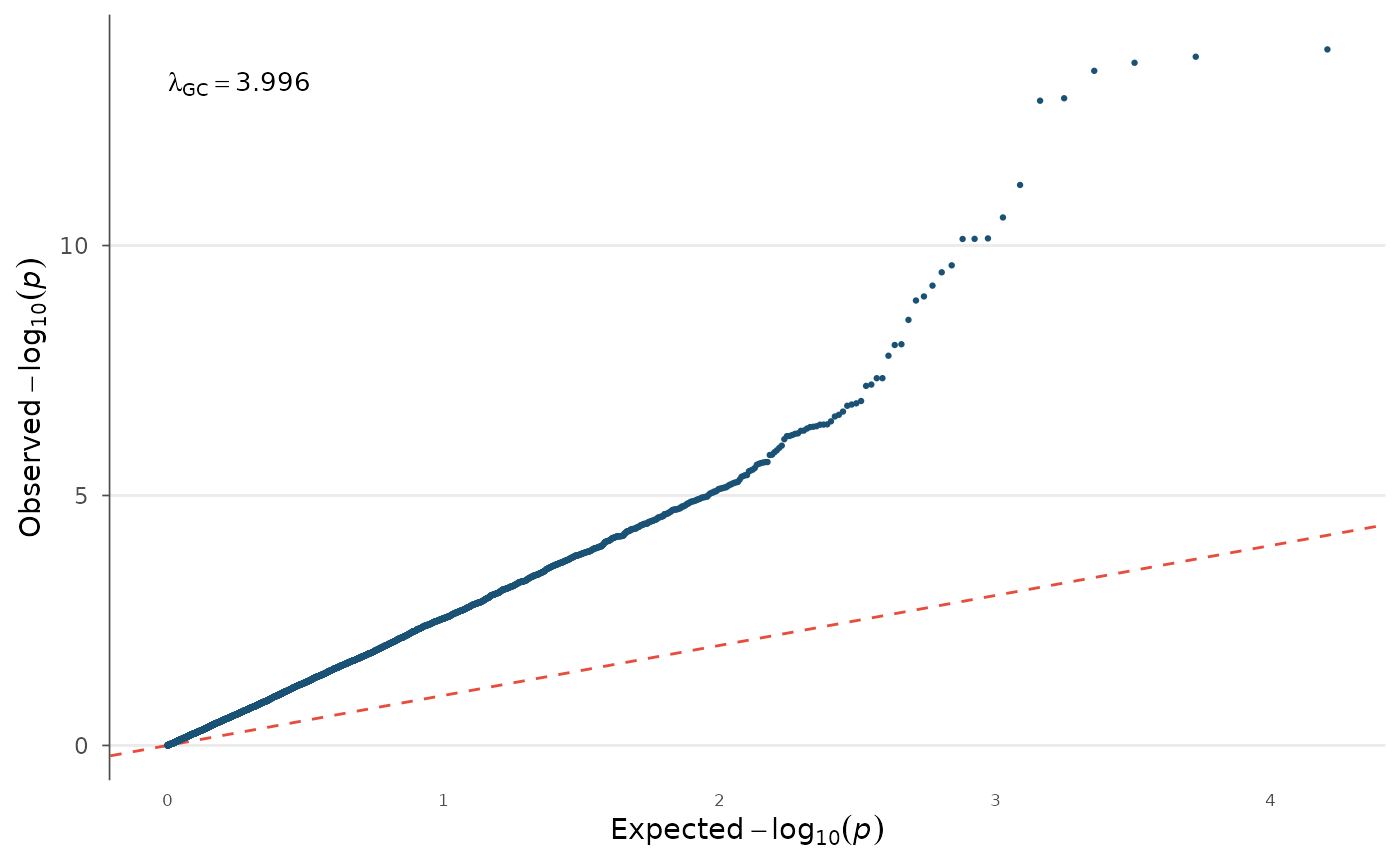
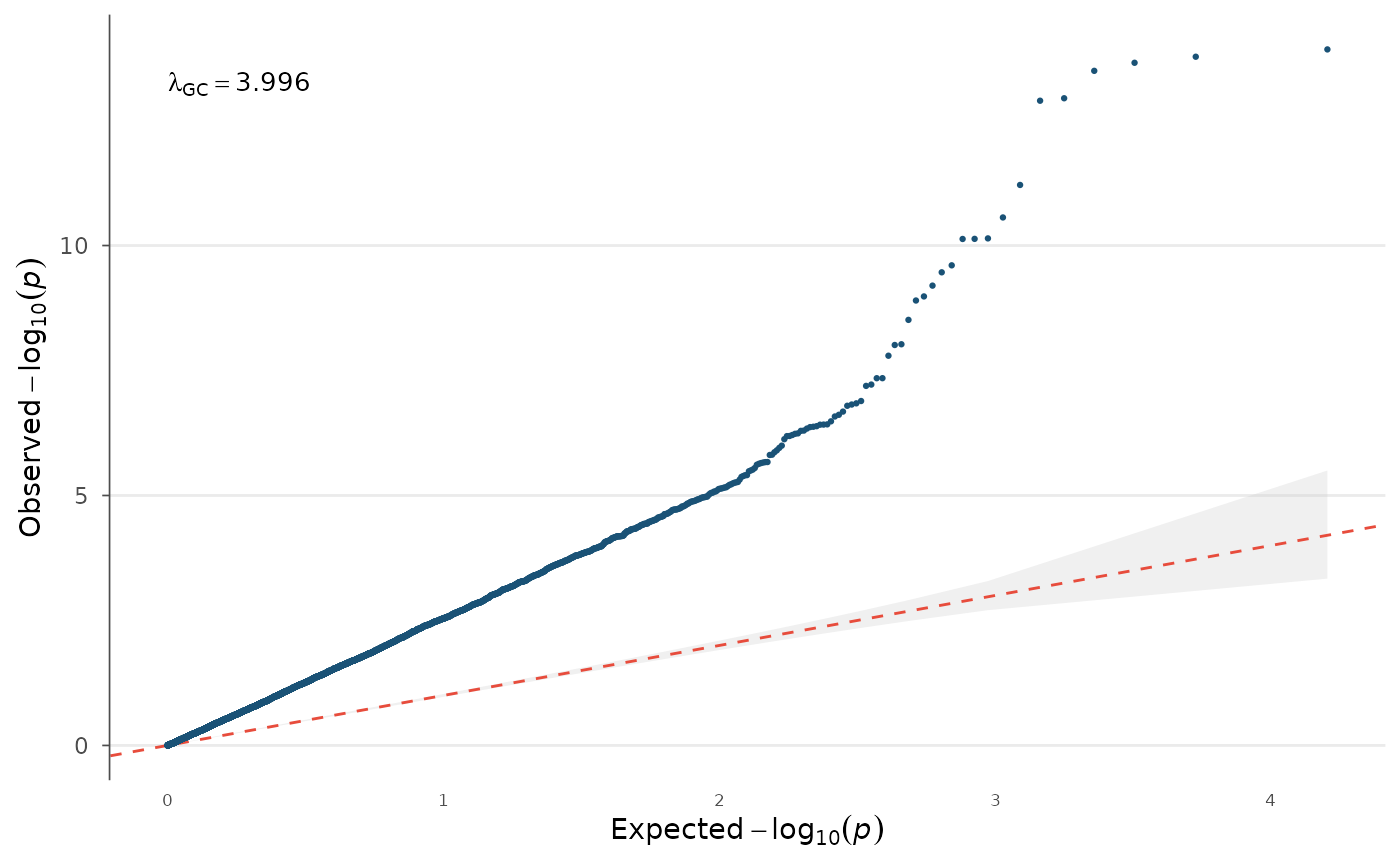 # Without confidence band
qq_plot(example_gwas, show_lambda = TRUE, ci = NULL)
# Without confidence band
qq_plot(example_gwas, show_lambda = TRUE, ci = NULL)
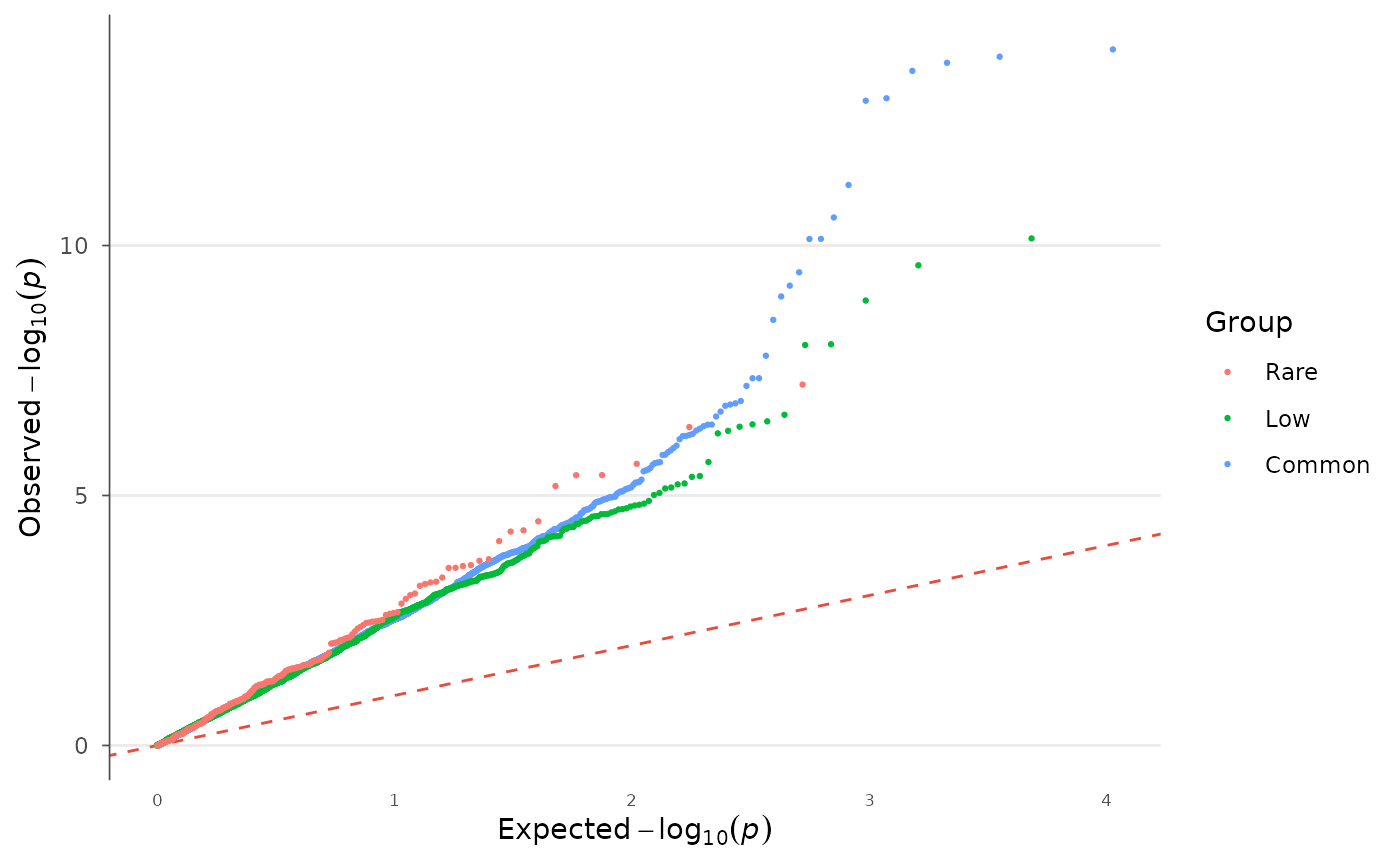
 # Stratify by allele frequency
example_gwas$maf_bin <- cut(example_gwas$AF, c(0, 0.05, 0.2, 0.5),
labels = c("Rare", "Low", "Common"))
qq_plot(example_gwas, group = "maf_bin")
# Stratify by allele frequency
example_gwas$maf_bin <- cut(example_gwas$AF, c(0, 0.05, 0.2, 0.5),
labels = c("Rare", "Low", "Common"))
qq_plot(example_gwas, group = "maf_bin")
 # Nature theme
qq_plot(example_gwas, show_lambda = TRUE) + theme_nature()
# Nature theme
qq_plot(example_gwas, show_lambda = TRUE) + theme_nature()