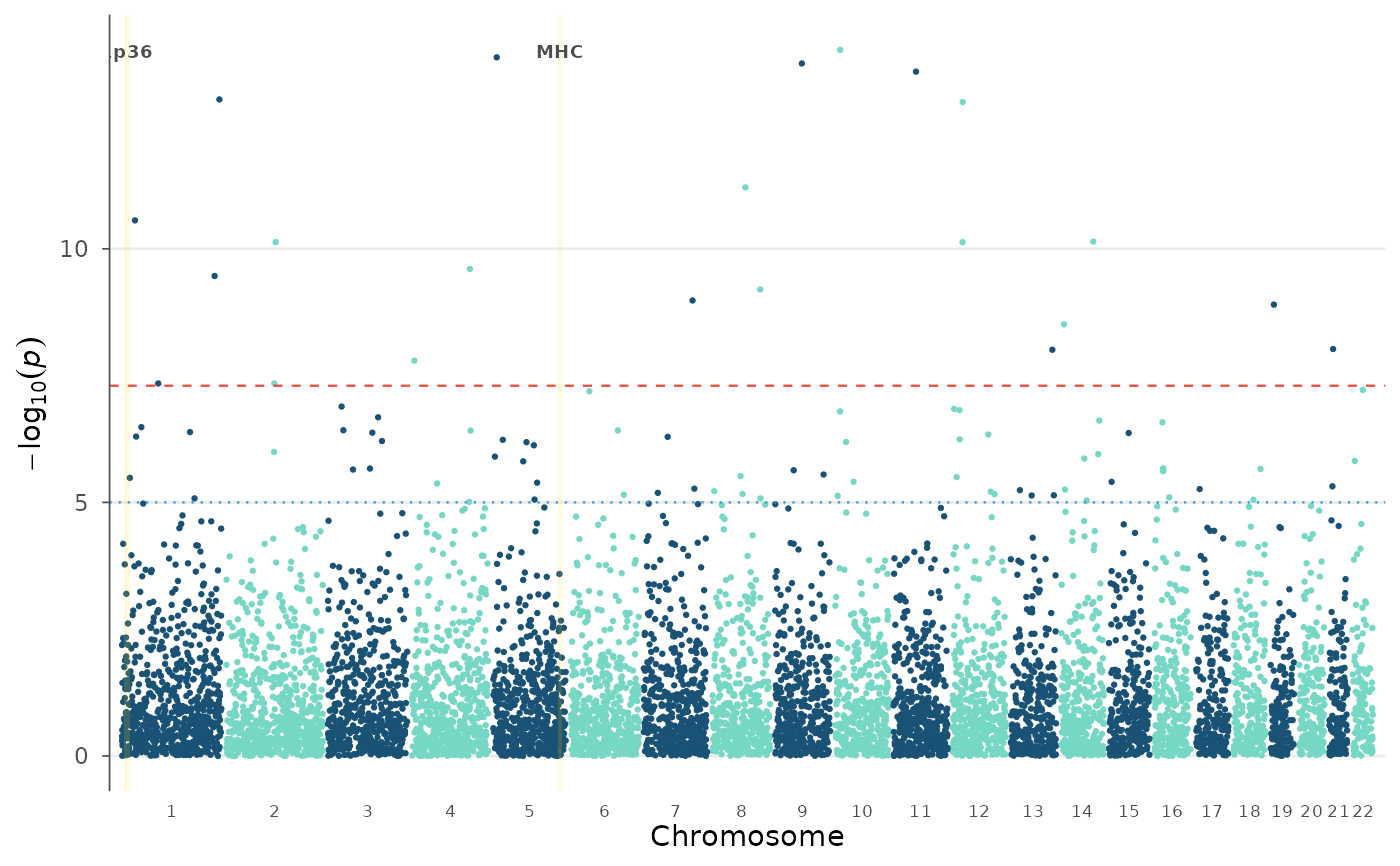
Draws colored rectangular bands behind specified genomic regions. Useful for marking known GWAS loci, MHC region, or custom regions of interest.
Usage
highlight_regions(
  plt,
  regions,
  color = "#FFD700",
  alpha = 0.15,
  label_size = 2.5,
  label_y = "top",
  border = FALSE,
  border_color = "grey40"
)
Arguments
- plt
A ggplot object from
manhattan_plot()or similar.- regions
A data.frame with columns:
chr(integer),start,end. Optional:label,color,alpha.- color
Default fill color for regions (if not specified per region).
- alpha
Default transparency.
- label_size
Font size for region labels.
- label_y
Y-axis position for labels ("top" or numeric value).
- border
If TRUE, draw a border around regions.
- border_color
Border color.
Examples
data(example_gwas)
plt <- manhattan_plot(example_gwas)
regions <- data.frame(
  chr = c(6, 1), start = c(25e6, 5e6), end = c(35e6, 20e6),
  label = c("MHC", "1p36")
)
highlight_regions(plt, regions)