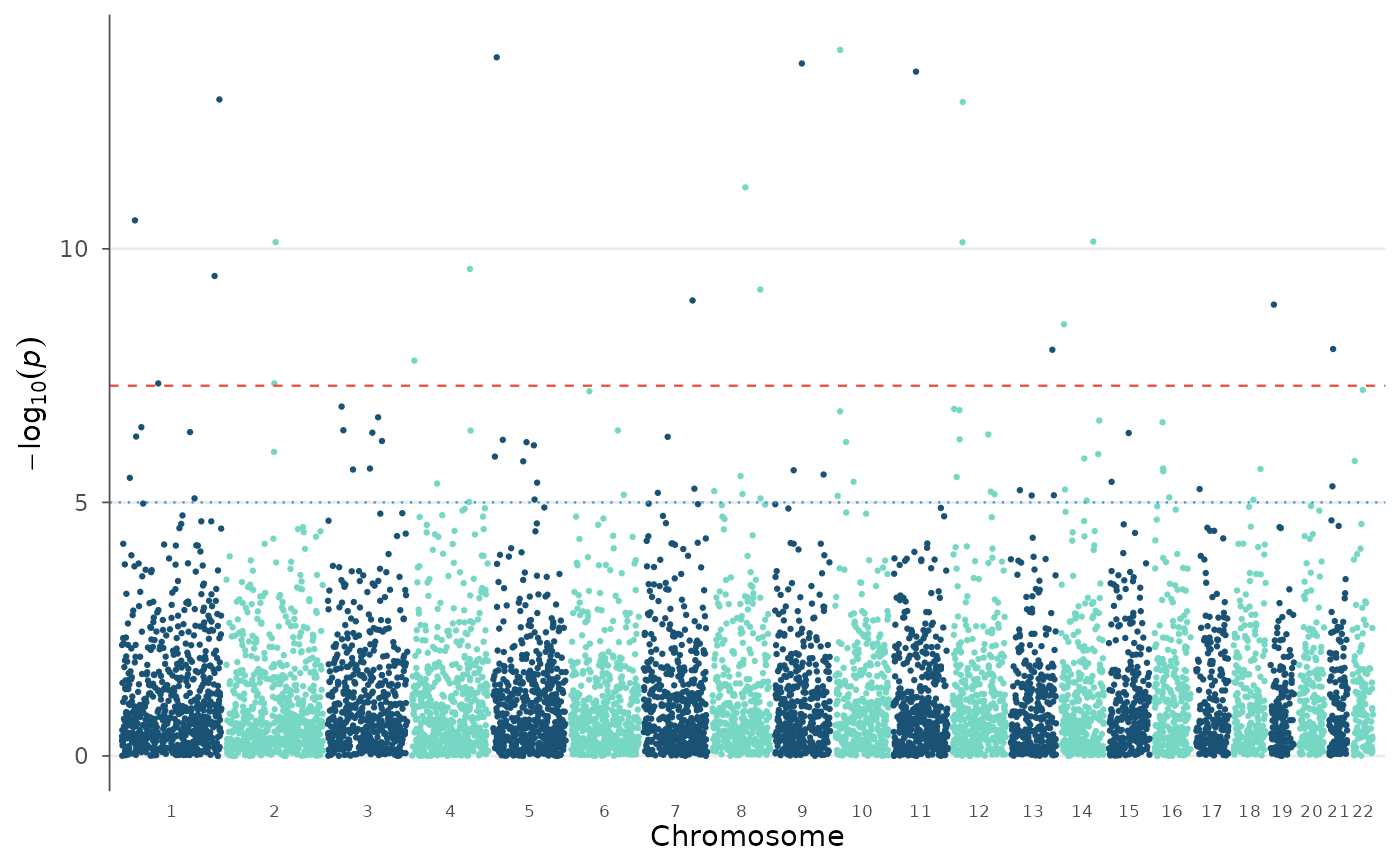
A convenience wrapper that annotates a dataset and then creates a Manhattan plot with gene names as labels instead of SNP IDs.
Usage
manhattan_genes(
  data,
  genes,
  gene_p_threshold = 1e-05,
  gene_top_n = 10,
  gene_max_distance = 5e+05,
  arrow = FALSE,
  arrow_color = "grey30",
  label_size = 3,
  label_face = "italic",
  ...
)
Arguments
- data
A
gwas_dataobject or data.frame with GWAS results.- genes
Gene annotation data.frame (see
annotate_genes()).- gene_p_threshold
P-value threshold for gene annotation.
- gene_top_n
Number of top genes to label.
- gene_max_distance
Maximum distance to nearest gene.
- arrow
If TRUE, use annotation arrows instead of text labels.
- arrow_color
Color of annotation arrows.
- label_size
Font size for gene labels.
- label_face
Font face for gene labels ("italic", "bold", "bold.italic").
- ...
Additional arguments passed to
manhattan_plot().