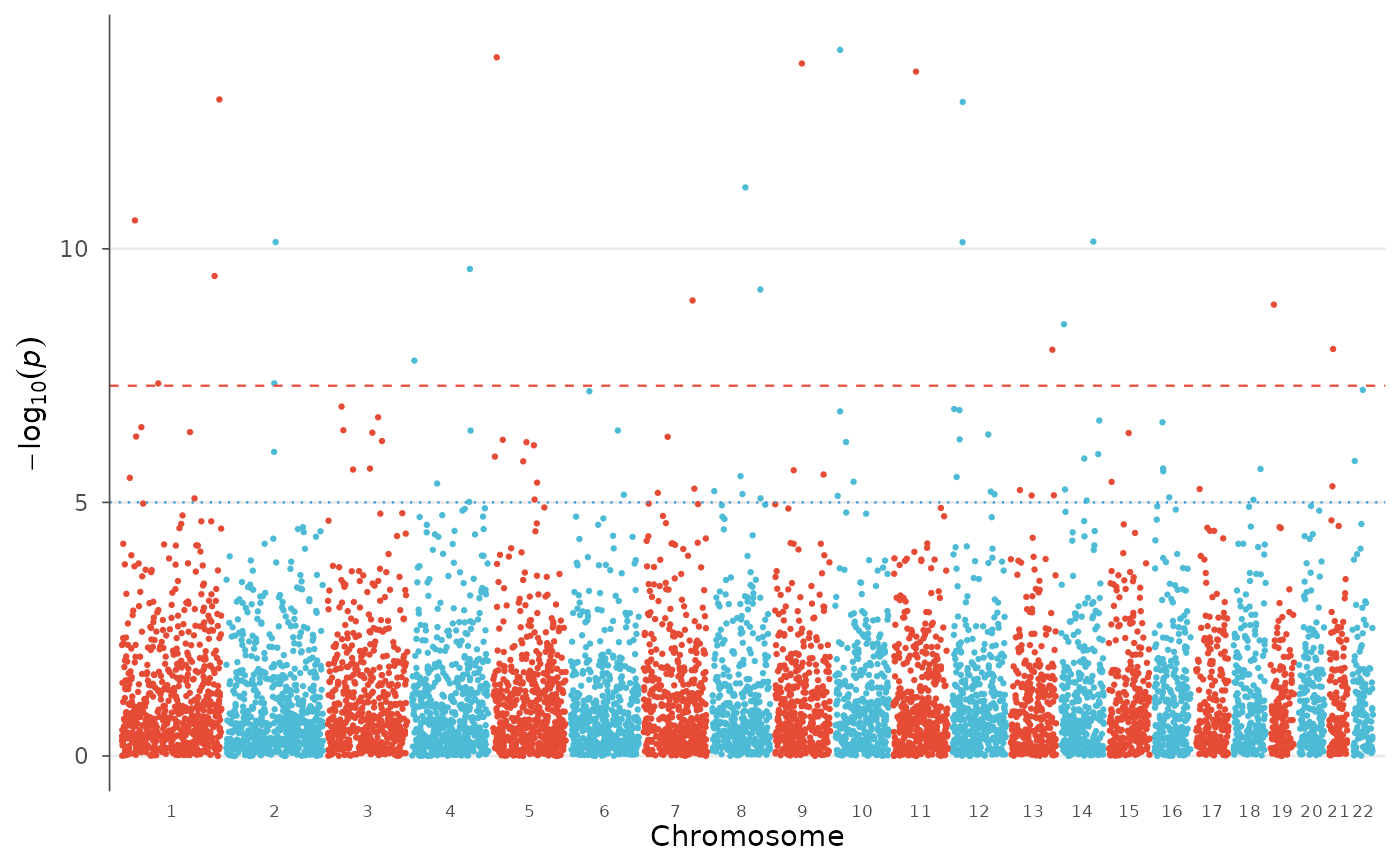
Alternating color scale for chromosomes in Manhattan plots.
Arguments
- colors
Two-element character vector of alternating colors.
- ...
Additional arguments passed to
ggplot2::scale_color_manual().
Examples
data(example_gwas)
manhattan_plot(example_gwas, colors = c("#E64B35", "#4DBBD5"))