Software
I write R packages for analyses that I run often, so that other people can repeat them. All of them are open source.
ggwas
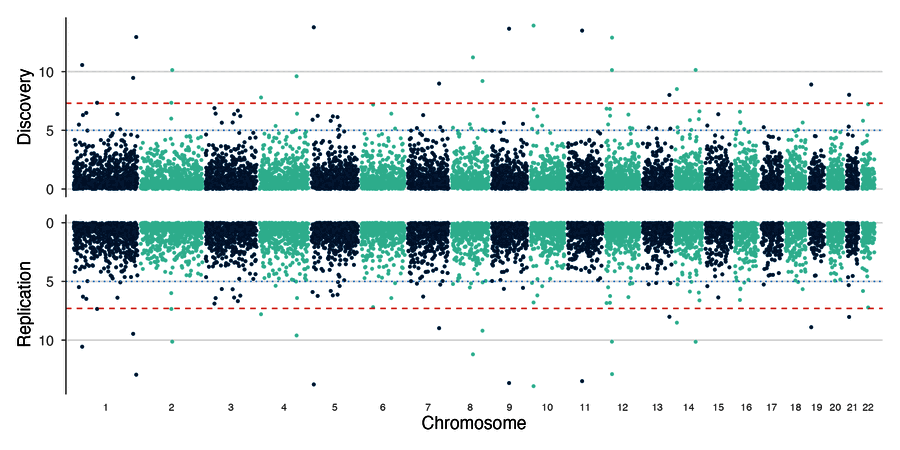
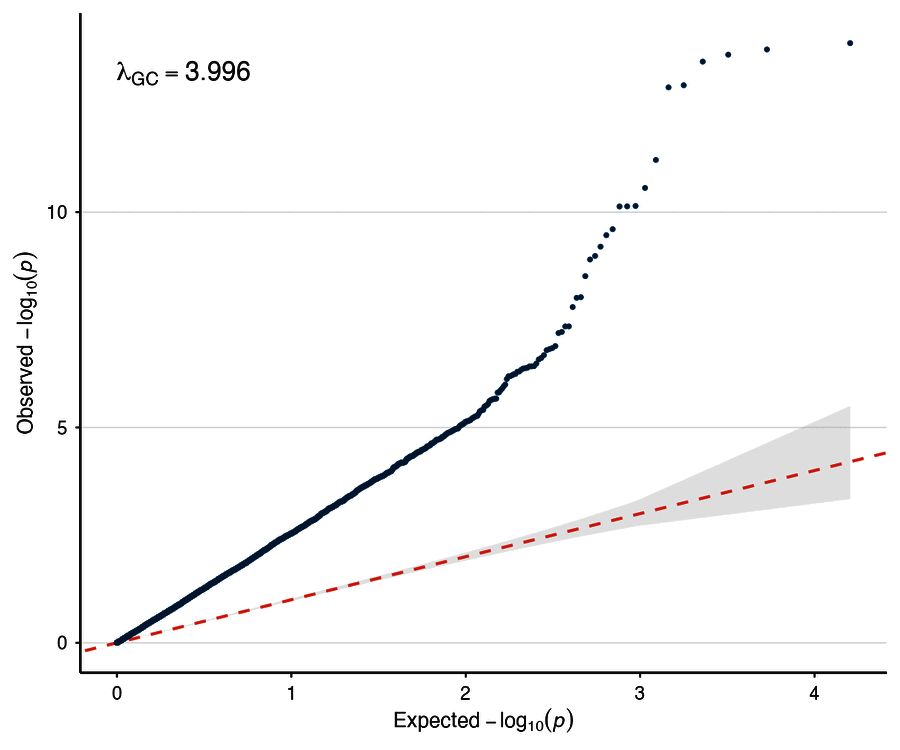
ggwas draws plots for genome-wide association studies with ggplot2. It covers the usual steps from quality control to figures for a paper: Manhattan, QQ, Miami and locus zoom plots, PheWAS, fine-mapping, colocalization and genetic correlations. It includes journal themes and colour-blind-safe palettes, and it downsamples points so that biobank-sized files still plot quickly. The package is under review at Bioconductor.
ggwas in a few lines
pak::pak("bczech/ggwas")

library(ggwas)
data(example_gwas)  # columns CHR, BP, SNP, P

manhattan_plot(example_gwas)
qq_plot(example_gwas, show_lambda = TRUE)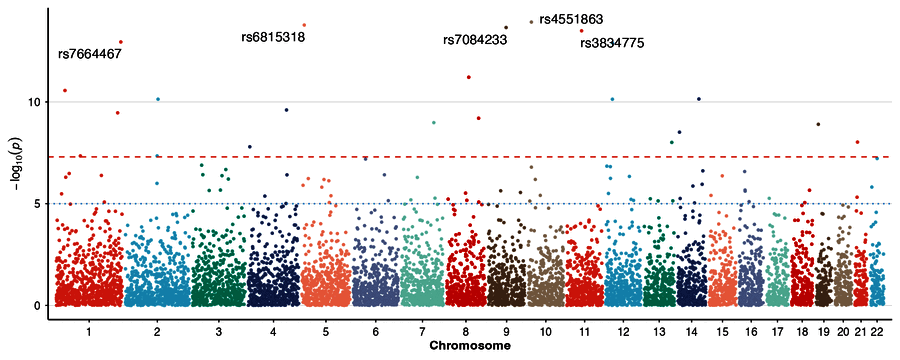
Gallery
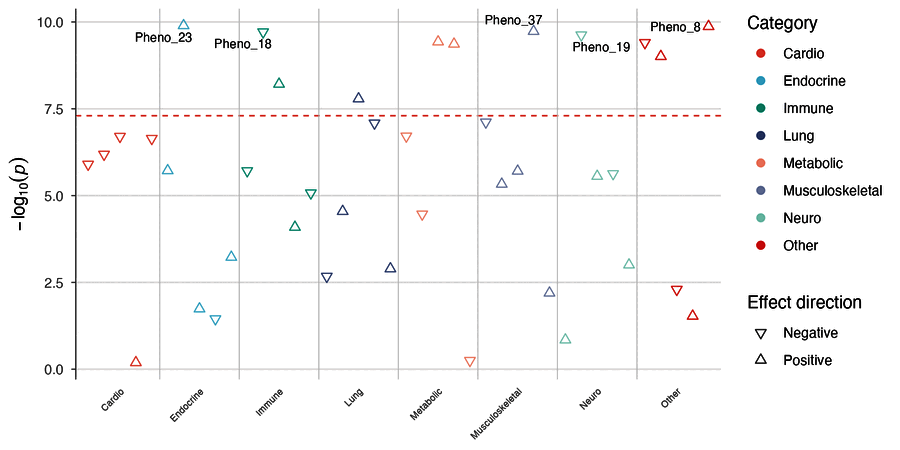
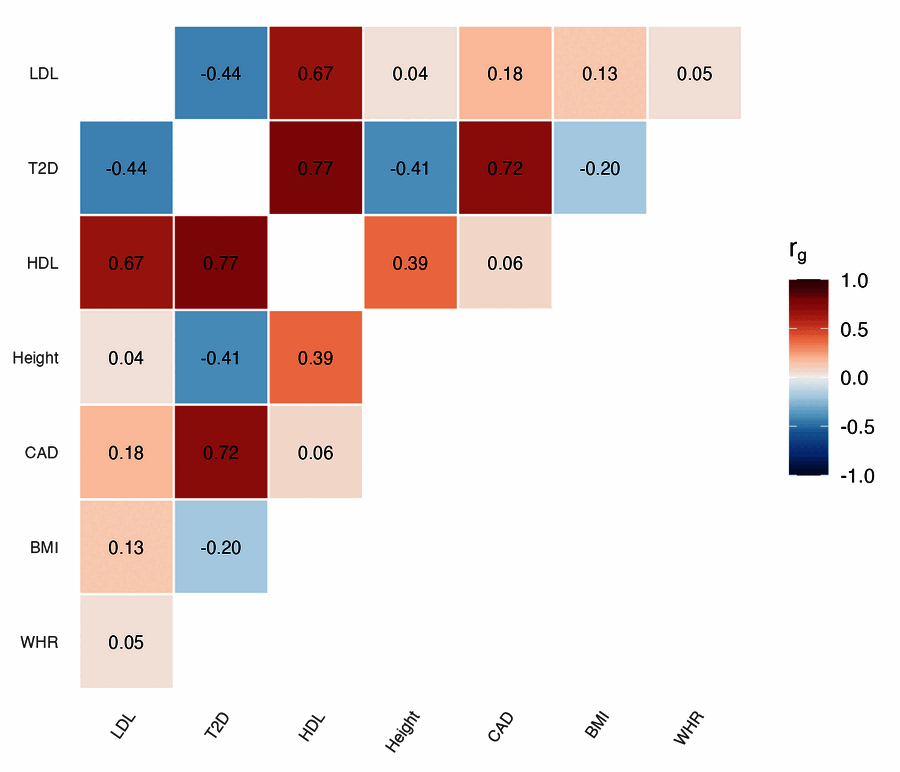
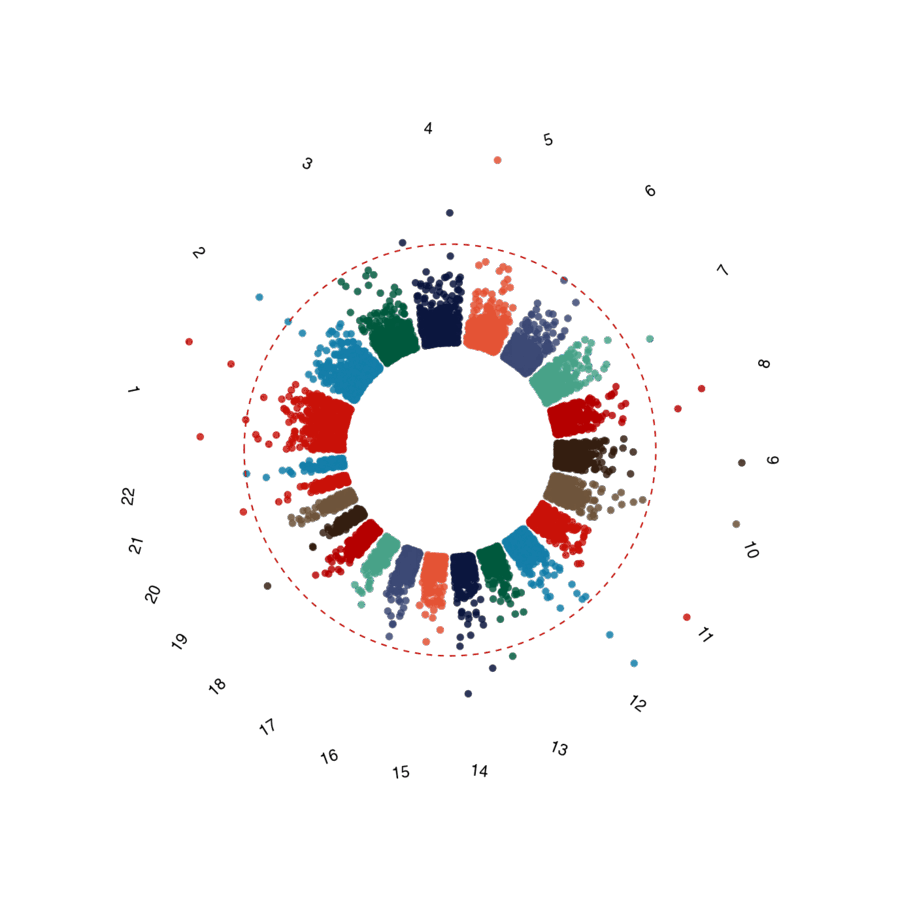
BRASSVis
BRASSVis plots gene fusions and structural variants found by BRASS in whole-genome sequencing data. Each fusion gets one page with chromosome ideograms, exon structure, a circos plot, retained protein domains and read support. The layout follows the Arriba fusion plots, adapted to BRASS output.
gDR
I contribute to gDR, an open-source R suite for processing and analysing drug response screens, available on Bioconductor. It processed the screens behind the papers in Cancers (2024) and Nature Communications (2025).
Internal tools
In pharmaceutical R&D I build R/Shiny applications for scientists and maintain production WDL pipelines for NGS data.